(“Metrics that Matter” is a short feature that appears every Tuesday, Wednesday, and Saturday, highlighting a notable fantasy lesson to be learned from PFF’s advanced stats.)
In our last two articles in this space, we discussed fantasy consistency. First, we looked at the top- and bottom-20 players by consistency of production and consistency of role. After that, we discussed consistency of production given gamescript. In the latter article, we were looking for – what one commenter put more eloquently than I – “predictable inconsistency.” In DFS specifically, players are typically valued at their “mean,” so when they are in an above-average matchup, they are a more attractive value.
Specifically with running backs, we noticed players not frequently involved in the passing game over-perform in matchups where their team takes a lead. The reverse is true for running backs heavily involved in the passing game. This can also help us when making tough start/sit decisions in redraft leagues. For a player like LeGarrette Blount (who only saw six targets last season), when determining whether or not to start him in any given week, I was looking at our projected box-score numbers or Vegas lines to determine how likely the Patriots were to hold a big lead. Needless to say, if you started Blount in New England blowouts, you would have made a lot of money over the past few seasons.
This realization begged a second question, “Who are the league’s every-down running backs?” Who are the running backs less likely to be taken off the field in obvious passing downs? Nearly every running back is still dependent upon gamescript in one way or another, whether they’re taken off the field when trailing in exchange for a more capable pass-catching back or if they’re an every-down back more likely to see a decrease in carries and an uptick in targets when trailing. However, clearly, for some running backs playing time is very dependent upon gamescript or down and distance.
This second question was a simple one, but fairly difficult to solve. I’ve tried looking at this a number of ways, and I’ll discuss some of them in an upcoming piece on “bell-cow running backs,” but here’s what I settled on: In the below chart, we’re looking at all running backs to see at least 500 snaps last season, and splitting each running back’s snap share to determine how often they were taken off the field on obvious passing downs – in this instance, on third down when the team needs to pick up at least six yards for a first down or touchdown.
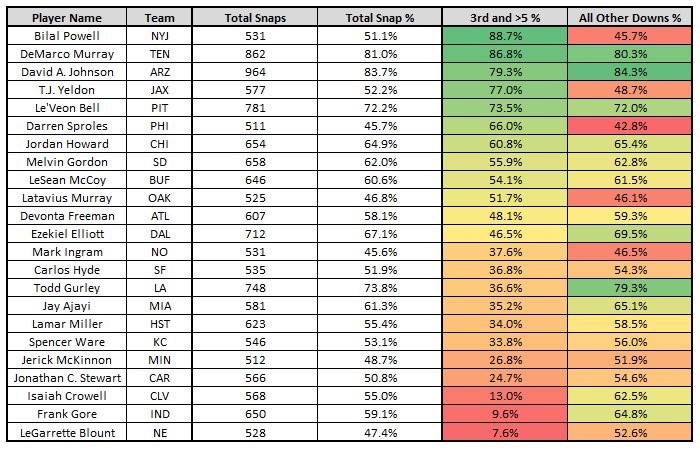
As you can see above, players like Bilal Powell and Darren Sproles were primarily used on passing downs. Last season, both profiled more as scatback/receiving specialists than true bell-cow running backs. Powell typically ceded carries to Matt Forte and Sproles ceded carries to Ryan Mathews. Players like Blount, Frank Gore, and Isaiah Crowell were taken off the field in obvious passing situations for the team’s receiving backs – James White, Robert Turbin, and Duke Johnson, respectively.
One issue with this chart, however, is that it also includes games where any of the above players sat out. Le’Veon Bell, in particular, would have ranked much higher if just considering games he played. Last season, only looking at games played, he saw 93 percent of his team's running back snaps, 94 percent of his team's running back carries, and 99 percent of his team's running back targets. For perspective, the next-closest running backs averaged 79, 88, and 85 percent, respectively. Melvin Gordon was another player who would have ranked much higher. Excluding Week 14 — when he saw only three touches and left early with an injury — and the other games he sat out, Gordon would have ranked second in snap percentage, third in carry percentage, and seventh in target percentage.
Outside of these two names, the obvious every-down backs were David Johnson and DeMarco Murray. Johnson was our most consistent player by production last season, failing to finish among the top-12 running backs in only one week he started and finished. Murray was equally consistent in opportunity and role, ranking top-five in both categories. He saw between 16 and 32 touches in every game but one, and failed to finish outside of the top-24 running backs in only two weeks. Both running backs also scored a higher percentage of their fantasy points when the team was trailing, which is atypical for most running backs. As evident in the chart above, they remained on the field in passing situations and benefited from the added target volume. Note: In PPR leagues, the average running back carry is worth 0.59 expected fantasy points, while the average target is worth 1.57 expected fantasy points.
Johnson, specifically, needs to be drafted within the first two picks in nearly every fantasy draft. He just totaled the second-most fantasy points per game of any player over the past decade, and it’s possible his role actually expands this season. He averaged 23.3 touches per game last year, and Bruce Arians said earlier this offseason he’d like to get that number up to 30.0.
In MFL10 best-ball leagues, Derrick Henry is being drafted as the No. 28 running back off the board. I know some think he’s more than a handcuff this year, and could push Murray for playing time, but I disagree. Earlier this offseason, when asked if Henry would be more involved, head coach Mike Mularkey said, “Murray is the guy. He has shown he is the guy and he will continue to be that guy.” One benefit Murray has over Henry is passing-down prowess. Henry ranked 152nd of 160 qualifying running backs in pass-blocking efficiency in college in 2014, and 113th of 158 in 2015. He totaled 583 touches over these two seasons, but only 15 of those were receptions. Murray saw 50 more targets than Henry last season, and will likely again pace Henry in this category. Playing on 87 percent of the team’s “passing downs” and 80 percent of all other downs, even if Henry does see an increased role, Murray has enough of a distance to fall to still return value at his RB9 ADP.